Mortgage Update - December 2nd, 2024
Hope everybody had a wonderful Thanksgiving with family and friends 🦃🍽️
In the spirit of the season, join me in making 5 gratitude calls every day this week. It can be family, team members, those in your circle of influence or even past clients. Be specific and authentic, its easy to tell if you’re fake.
This can be simple but SUPER powerful way to spark conversations.
We are posting regular content to Instagram (Nick | Kreg) and Facebook (Nick | Kreg) to help you and your buyers stay informed. Be sure to follow us!
Read time: ~4 minutes
Digging Deeper into the US Labor Market 👷♂️👷♀️
The first week of every month is always a big one. We get 3 big data points specific to the labor market with the big Bureau of Labor & Statistics Non-Farm Payroll Report on the first Friday. This will be the first one post election.
What are the latest trends Kreg & I are seeing on the labor front 👀?
1️⃣ Election Fallout on Jobs:
We can all be thankful the election is behind us, but the fallout may be interesting from an employment perspective. Heading into the election, the U.S. economy added 112,000 government jobs at federal, state, and local levels, largely for campaign efforts. These temporary boosts helped prop up the Non-Farm Payroll numbers. But now that the election is over, what happens when those jobs disappear?
2️⃣ Job Market Softening:
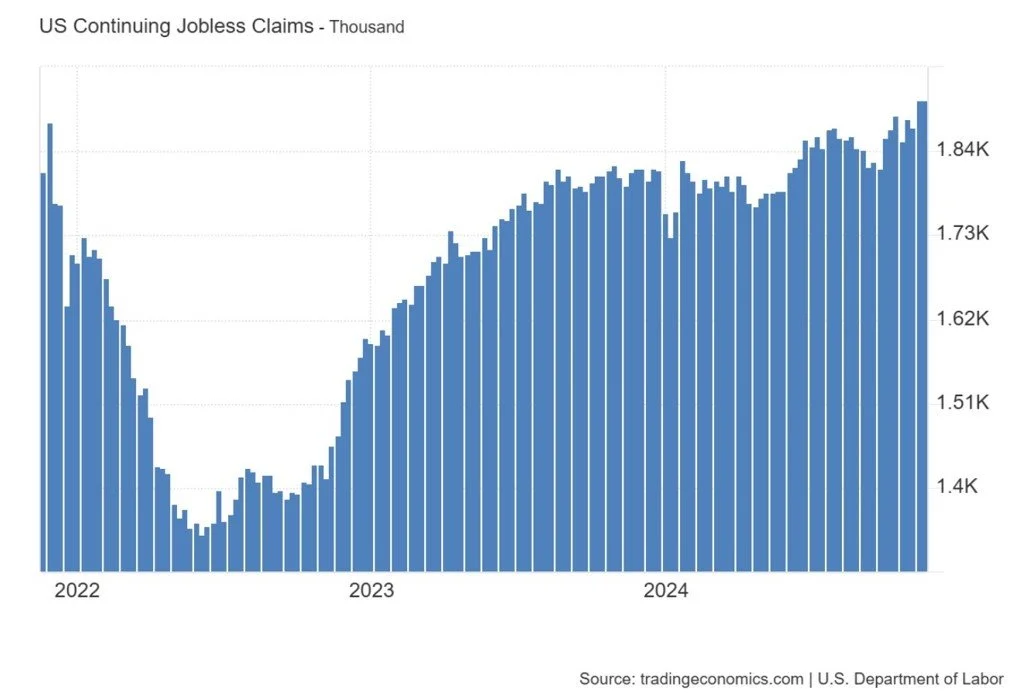
Continuing jobless claims have been ticking upward—signaling a softening job market, not a breaking one. We’re watching closely, but so far, no red flags pointing to a collapse.
Continuing US jobless claims have continued to increase in recent weeks showcasing a “softening” job market, not a “breaking” job market.
The ratio of continued unemployment claims to the total civilian labor force is an interesting recession indicator. We are currently at a ratio of 1.102% (just a hair above the all-time low of 0.825% in June of 2022) and have a way to go until we reach a breaking point, which is a good sign.
3️⃣ An Overlooked Indicator—QCEW Data:
The real hidden gem here is the Quarterly Census of Employment and Wages (QCEW). This data, released in late November, aggregates nearly all U.S. employer tax filings, providing a clearer picture of job growth.
The latest QCEW data showed 1.246 million jobs created from June 2023 to June 2024—far below the 2.5 million jobs originally reported by the BLS.
That’s about a 100,000 monthly miss on average!
While the BLS Non-Farm Payroll numbers grab the headlines, they’re an estimate—an art, not a science. Meanwhile, the more accurate QCEW data goes largely unnoticed. Don’t believe it? Try Googling “QCEW” and see how little attention it gets.
As the labor market continues to shift, these discrepancies will be crucial to understanding where the economy is really heading. Stay tuned—we’ll keep you in the loop. 💡
Key Takeaway: Continuing unemployment claims are slowly inching higher week after week, however, the ratio of those claiming unemployment relative to the total labor force is still near historical lows. The bigger concern is the accuracy of the government’s monthly near real-time data that the market tends to action more so than the revisions. It appears June 2023 to June 2024, the US labor market added 1.2 million FEWER jobs than originally reported. Makes you wonder if some of those months were actually a net loss of jobs.
Join This Facebook Group Now!
I came across this FB group and its a gold mine of VERY NUANCED questions 👇
As a loan officer or real estate agent, you want to stay on top of your customer’s needs. You can jump right in and start to provide value to drive traffic back to you 🤝
The questions are super easy for y’all to knock out of the park based on the replies I’ve seen so far. This is your opportunity to stand out 🔦
BONUS : You can use these questions on your Google My Business Q&A section OR to help create your next piece of content.
Q&A For First Time Buyers FB GROUP


